Customer Journey Mapping
Customer journey mapping visualises the complete player experience from first brand awareness through long-term engagement and advocacy. Understanding and optimizing each stage of the player journey enables Gaming companies to improve user acquisition, boost conversion rates to First Time Deposit (FTD), increase player lifetime value, and build lasting player loyalty through data-driven insights and personalised experiences.
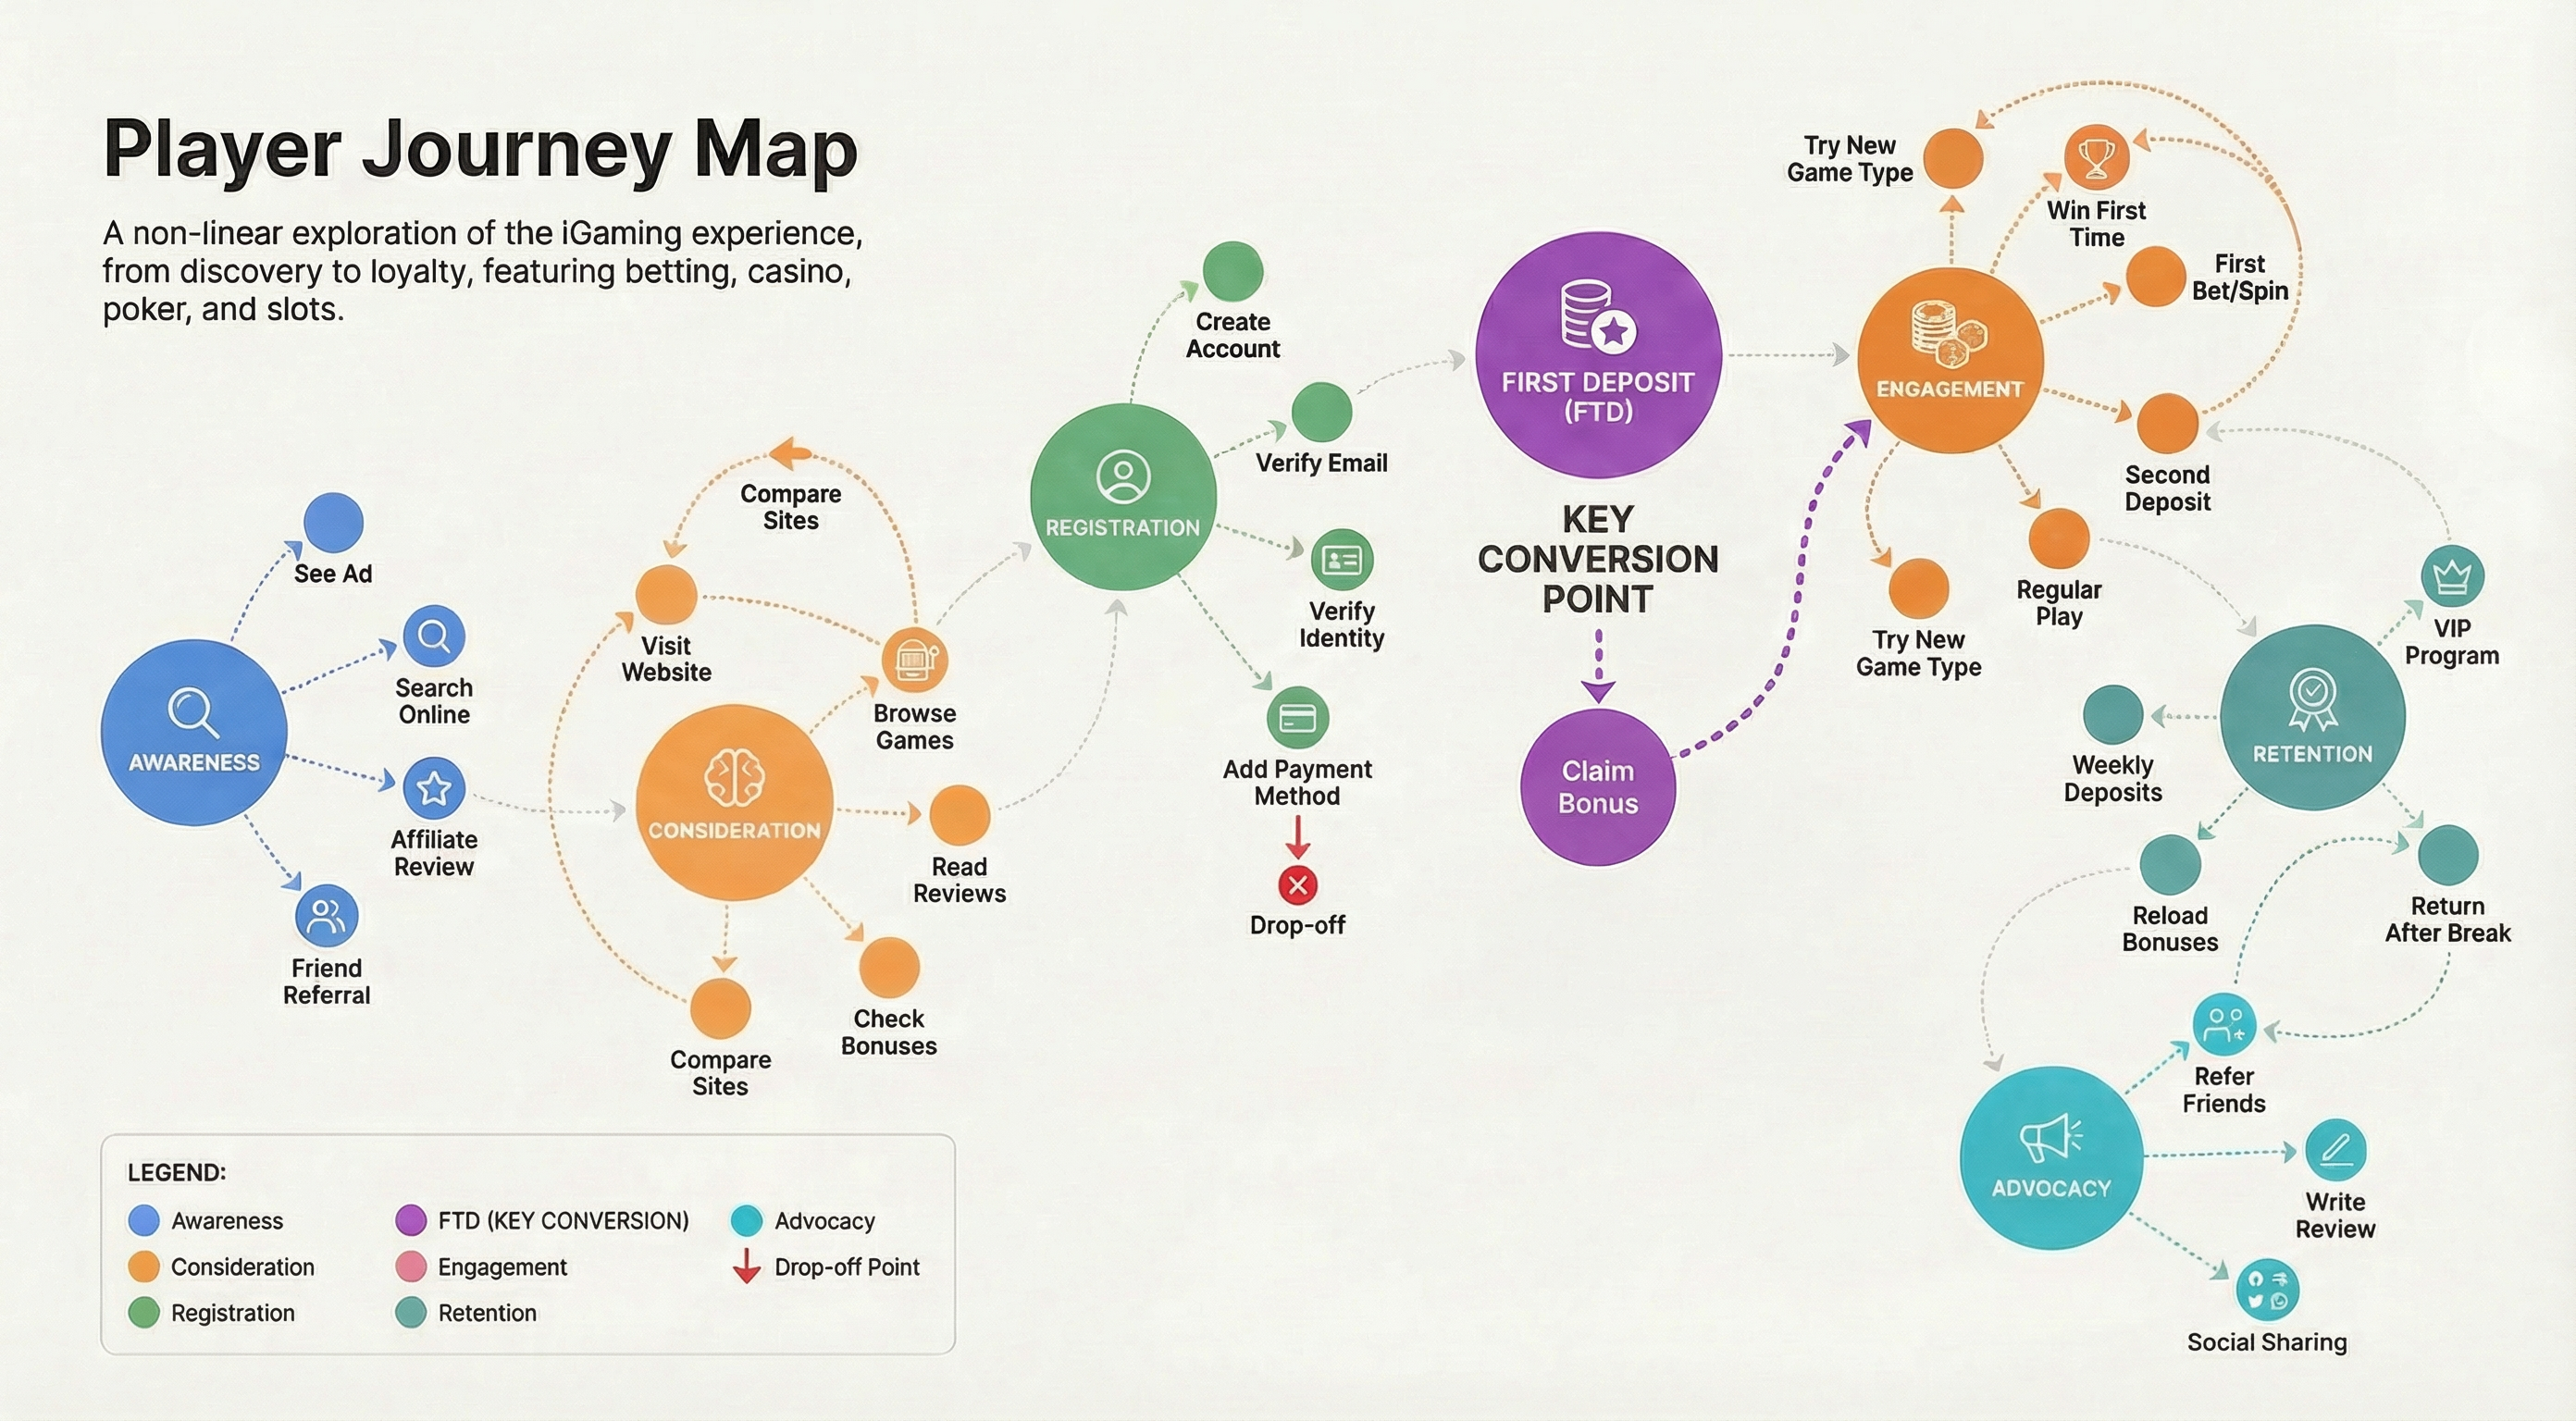
A visual journey map helps teams understand the non-linear, often chaotic nature of player paths in Gaming. Unlike linear funnels, real player journeys involve loops, backtracking, and multiple touchpoints before the critical First Time Deposit (FTD) conversion. The diagram below shows how players move between awareness, consideration, registration, first deposit, engagement, retention, and advocacy stages in unpredictable patterns.
Touchpoint Types:
Note: Real player journeys in Gaming are rarely linear. Players may loop back to previous stages (e.g., comparing sites after registration, returning after a break through reactivation campaigns), skip stages (e.g., immediate depositors), or follow entirely different paths based on their motivations, game preferences (sports betting vs. casino vs. poker), and risk tolerance. Use analytics data to identify the most common paths and optimise those first, with particular focus on the critical FTD conversion point.
The Gaming player journey encompasses seven critical stages that players progress through from initial awareness to becoming advocates. Each stage presents unique opportunities for engagement, optimisation, and value creation for both players and Gaming operators.
| Stage | Description | Key Objectives | Success Metrics |
|---|---|---|---|
| 1. Discovery/Awareness | Player first encounters your brand through marketing channels, affiliates, search engines, or word-of-mouth | Generate interest, communicate unique value proposition, drive site visits | Impressions, reach, click-through rate, site visits, CPC |
| 2. Consideration | Player explores your site, browses games, reads reviews, compares bonuses and payment methods | Build trust, showcase game variety, highlight competitive advantages | Pages per session, time on site, bounce rate, game demo plays |
| 3. Registration | Player creates account, completes KYC/AML verification, adds payment method | Reduce friction, ensure compliance, build confidence in security | Registration rate, verification completion rate, CPA (Cost Per Acquisition) |
| 4. First Time Deposit (FTD) | Player makes their first deposit - the critical conversion point in Gaming | Maximize FTD conversion, optimise bonus offers, ensure seamless payment experience | FTD rate, FTD amount, CPD (Cost Per Deposit), time to FTD |
| 5. Engagement | Player places bets/spins, experiences wins and losses, explores different game types | Build habits, encourage cross-sell, optimise game mix, balance player experience | Active days, bet count, GGR (Gross Gaming Revenue), game diversity |
| 6. Retention/Loyalty | Player returns consistently, makes regular deposits, progresses through VIP tiers | Maintain engagement, reward loyalty, maximise lifetime value | Deposit frequency, NGR (Net Gaming Revenue), churn rate, LTV |
| 7. Advocacy | Highly engaged players who recommend your brand and participate in referral programs | Encourage referrals, facilitate sharing, build community | Referral rate, referred FTDs, social shares, reviews |
Touchpoints are the specific interactions between players and your Gaming brand across all channels and platforms. Mapping these touchpoints reveals opportunities to optimise the player experience, reduce friction, and increase conversion at every stage of the journey.
Pre-Registration Touchpoints
| Touchpoint | Channel | Optimisation Focus |
|---|---|---|
| Paid advertising (UA campaigns) | Google Ads, Facebook, affiliates, sports media | Creative quality, targeting, CPC optimisation, bonus messaging |
| Affiliate/comparison sites | Review sites, bonus aggregators, tipster sites | Competitive bonus offers, brand reputation, payment speed |
| Organic search (SEO) | Google, Bing | Content quality, keyword targeting, site authority |
| Social media presence | Twitter, Instagram, YouTube, Twitch | Community engagement, content quality, influencer partnerships |
| Word-of-mouth/referrals | Organic sharing, referral programs | Incentive structure, sharing friction, tracking |
Post-Registration Touchpoints
| Touchpoint | Timing | Optimisation Focus |
|---|---|---|
| Welcome email sequence | Immediately after registration | Clear CTA to deposit, bonus explanation, trust signals |
| First deposit prompt | Within 24 hours of registration | Bonus visibility, payment method variety, deposit limits |
| Game recommendations | After first deposit | Personalisation, game diversity, RTP transparency |
| Push notifications / SMS | Ongoing (event-based) | Timing, messaging, frequency, opt-in rate |
| Promotions & bonuses | Weekly/event-based | Bonus value, wagering requirements, game restrictions |
| VIP program communications | After reaching thresholds | Tier benefits, personalisation, exclusivity |
| Customer support | As needed | Response time, resolution rate, satisfaction |
| Withdrawal experience | Player-initiated | Processing speed, method availability, fees |
| Re-engagement campaigns | After 7+ days inactive | Win-back rate, incentive effectiveness |
1. Use Data to Inform Your Map
Base your journey map on actual player behavior data from analytics platforms (Matomo, Google Analytics, custom BI tools) rather than assumptions. Track drop-off rates at each stage, measure time between stages (especially registration to FTD), and identify common paths through your site. Pay particular attention to the critical FTD conversion funnel.
2. Segment by Player Type
Different player segments (high-rollers vs. casual players, sports bettors vs. casino players, slots vs. table games) follow different journeys. Create separate journey maps for your key segments to identify unique optimisation opportunities for each group. Consider geographic differences due to regulatory variations.
3. Identify Pain Points and Friction
Mark every point where players experience frustration, confusion, or abandonment. Common pain points include complex KYC processes, limited payment methods, unclear bonus terms, slow withdrawals, and aggressive responsible gambling interventions. Use session replay tools to observe actual player behavior.
4. Map Emotions Throughout the Journey
Track the emotional arc of your player journey from excitement (seeing bonus offer) through potential anxiety (KYC verification, first deposit) to satisfaction (first win) and potential frustration (losses, withdrawal delays). Design touchpoints that maintain positive emotional momentum while managing responsible gambling concerns.
5. Connect Touchpoints to Business Goals
Every touchpoint should support specific KPIs: awareness touchpoints drive site visits (CPC), consideration touchpoints drive registrations (CPA), registration touchpoints drive FTDs (CPD), engagement touchpoints drive GGR and NGR, retention touchpoints drive LTV and reduce churn.
6. Continuously Update Your Map
Player behavior evolves with regulatory changes, market trends, and competitive dynamics. Review and update your journey map quarterly, especially after major product launches, regulatory updates, payment method additions, or significant changes to bonus structures.
7. Test and Optimize Each Stage
Use A/B testing to optimise critical touchpoints: test registration form variations for completion rate, test bonus messaging for FTD conversion, test payment method ordering for deposit success rate, test re-engagement messages for win-back rate. Focus heavily on the FTD conversion funnel as it's the most critical business metric.
Understanding industry benchmarks helps you evaluate your player journey performance and identify areas for improvement. These benchmarks vary significantly by vertical (sports betting, casino, poker), geography (regulatory environment), and player acquisition channel.
| Metric | Sports Betting | Online Casino | Poker |
|---|---|---|---|
| Registration to FTD Rate | 25-40% | 30-45% | 15-25% |
| Average FTD Amount | $50-$150 | $30-$100 | $40-$120 |
| First Month Retention | 35-50% | 30-45% | 20-35% |
| Average LTV (12 months) | $300-$800 | $200-$600 | $400-$1000 |
| Monthly Churn Rate | 15-25% | 20-30% | 25-35% |
Note: These benchmarks are approximate and vary based on specific market conditions, regulatory environment, bonus aggressiveness, brand strength, and player acquisition quality. Use them as directional guides rather than absolute targets. Regulated markets (UK, Spain, Italy) typically show different patterns than less regulated markets.
| Tool Category | Purpose | Examples |
|---|---|---|
| Analytics Platforms | Track player behavior, measure KPIs, identify drop-offs | Google Analytics, Matomo, Adobe Analytics, Mixpanel |
| Attribution Tools | Measure UA campaign effectiveness, track player sources | Adjust, AppsFlyer, Branch, Kochava |
| Visualisation Tools | Create visual journey maps, share with stakeholders | Miro, Lucidchart, Figma, Mural |
| A/B Testing Platforms | Test and optimise touchpoints, measure impact | Optimizely, VWO, Google Optimize, AB Tasty |
| CRM & Marketing Automation | Personalize messaging, automate campaigns, re-engage players | Salesforce, Braze, Iterable, Customer.io |
| Session Replay Tools | Watch actual player sessions, identify UX issues | Hotjar, FullStory, Smartlook, Mouseflow |